
Claudio Cappabianca – AIPnD
Davide Baratto, Alberto Anzani – Gilardoni
The use of composite materials in the aeronautical and aerospace sectors has had an exponential increase from the early 1960s to today, thanks to the availability of a vast variety of composites. The use of these new materials has at the same time imposed an adaptation in non-destructive testing both in the construction-assembly phase and in the operating phase. Tomography is currently the only method able to provide information relating to the defectology, see dislocation defects, structural defects, and on dimensional aspects even of complex elements. Some applications of high-resolution tomography and 3D tomography on components for aeronautical and aerospace use will be illustrated.
Tomography (CT)
The tomographic method uses micro-focus, mini-focus, or conventional X-ray sources depending on the spatial resolution and absorption requirements of the object being inspected. The CT is able to reconstruct 3D images to check the arrangement of the fibers, any internal and/or external defects, linear measurements.
Principles of tomography
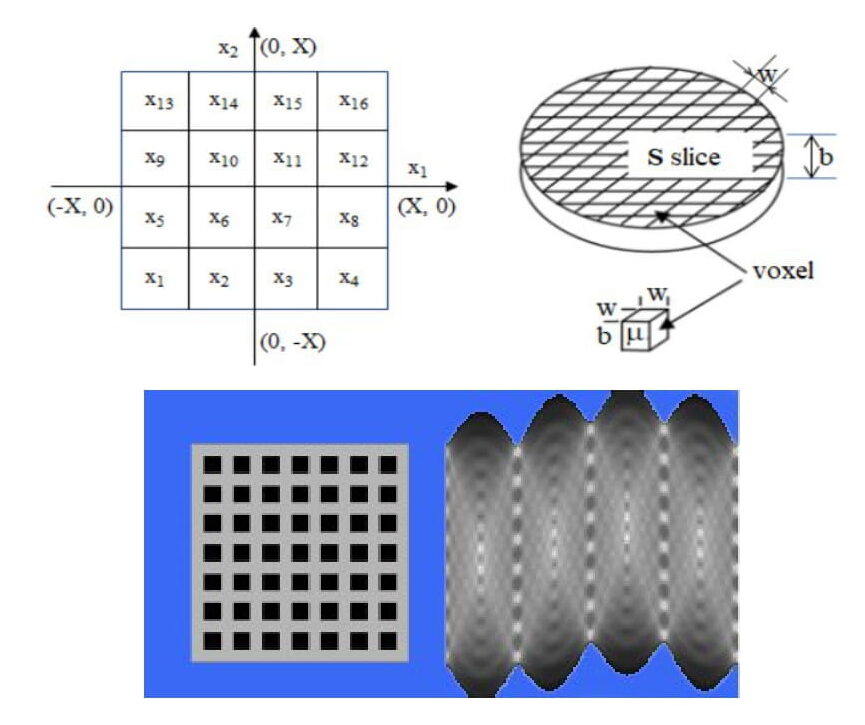
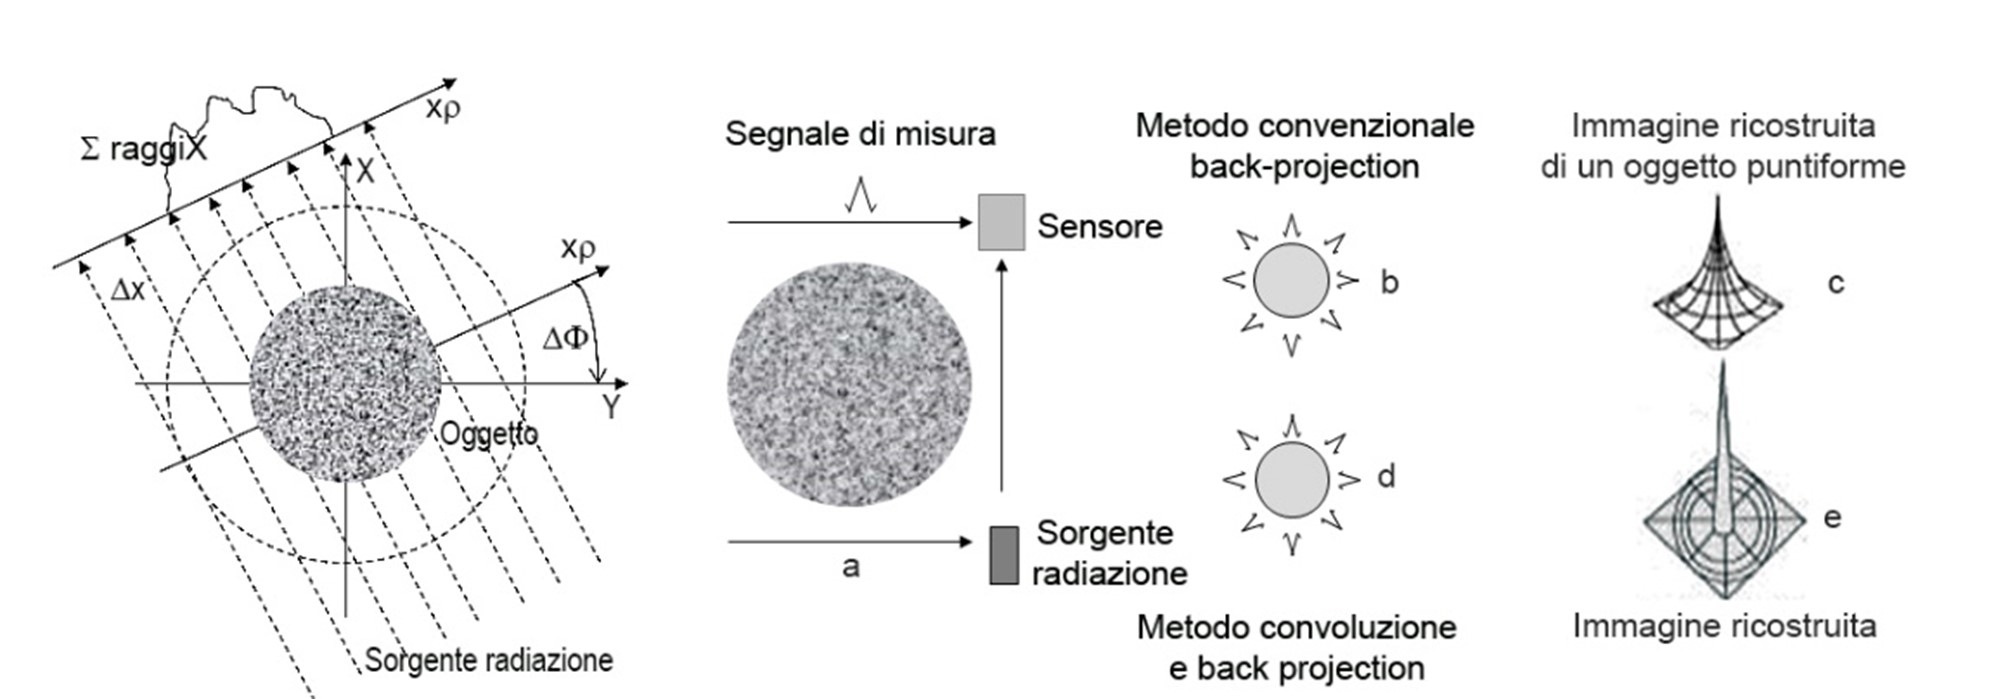
In all types of tomography an axis is always identifiable, called the tomographic axis. The direction of the tomographic axis corresponds to the axis of rotation of any mobile parts of the tomograph or, in cases where nothing rotates, the axis of symmetry of the system, such as, for example, the axis of symmetry of the detector rings in the pet extension. The volume to be reconstructed is usually sectioned into slices, which are perpendicular to the tomographic axis, transversal slices, fig.1.
They have a height b, called the thickness of the slice. Each slice is divided by a 2D Cartesian grid into square pixels with side w. Since the slice is associated with the thickness b, the pixels become voxels. A voxel is therefore a parallelepiped with a square section (side w) in the plane of the slice and of height b in the direction of the tomographic axis. The reconstruction of tomographic data is the determination of the density values, i.e. the value of the radiation in each voxel. Resolution is a function of voxel size.
The final result is the summation of a series of not necessarily contiguous sections of pre-set thickness: the set of reconstructed sections constitute the data relating to the scanned volume reconstructed by a three-dimensional rendering software. Images relating to any spatial plane can be obtained: frontal, sagittal, axial, or three-dimensional images. The reconstruction processes for obtaining images from raw data, rawdata, are convolution and back-projection, back-projection (Radon transform).
Convoluzione and back projection
Attenuation is the natural logarithm of the incident beam intensity ratio of the transmitted beam, and is also referred to as the ray-sum. The process is repeated N times at different angles. The angular increment between projections is denoted Df. The total angular range over which these projections are obtained can be limited to 180°. A reconstructed image of the 2D distribution of the linear attenuation coefficient μ(x, y) is obtained from these projections, and in principle it suffices to note that the linear attenuation coefficient is approximately proportional to the mass density.
Suppose we tomography a circular object with a central insert of different density: the response curve of the detector is indicated in a and in b the shift curves in relation to the various camera angles; in c the relative summation is shown. As you can see, the resulting image is not a point but a cone that widens. The reconstructive method of the convolution applied to backprojection adds a negative value which reduces the value obtained when the radiation beam encounters a punctiform object or there is a sudden change in the attenuation factor: in e and d the result, fig.2.
Mathematically we pass from an algorithm of the type:
∫µ(s) ds = -ln (I/Io)
to a more complex algorithm:
P(q,r) = -ln[I(q,r) ¤ Io]=∫µ(x,y) ds
Where I represents a single ideal measurement but also indicating that the detector is placed with respect to the object at the same angle q and in the same position r, Io the level of the unattenuated signal, m(x,y) is the linear attenuation coefficient of the object in two dimensions, ds is the distance along the radiation beam traversed by the object at angle q and position r. The values of I(q,r) are normalized to unity and calculated in such a way as to obtain a set of integral lines estimated through the object P(q,r).
The convolution process in the spatial domain is equivalent to a multiplication in the frequency domain.
f (x, y) = g (x, y) X h (x, y)
where:
- f(x,y) is the reconstructed and filtered section
- g(x,y) is the back-projected section
- h(x,y) is the filter function
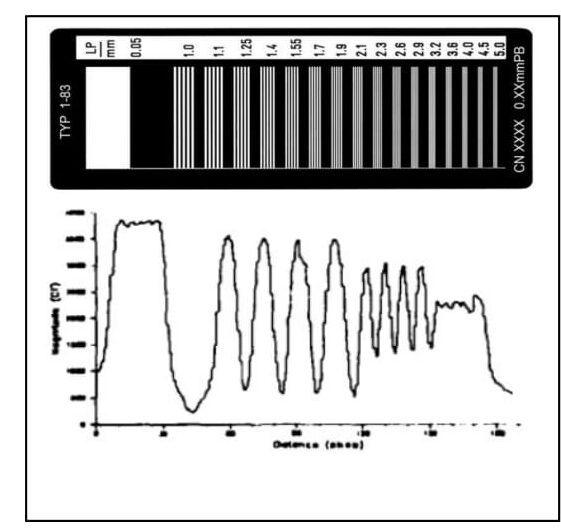
Contrast sensitivity and resolution
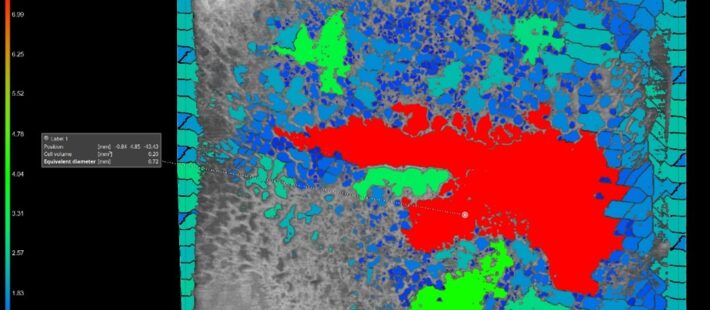
The contrast sensitivity measure is obtained by taking a region in the reconstructed image with Al reference samples and calculating the mean and standard deviation for all CT numbers in the region of interest. The ratio of the mean to the standard deviation is used as a signal-to-noise measure, an important indicator of system performance, Fig.3. Having to inspect components with differences in X-ray absorption, see the second example shown, particular precautions are necessary to obtain a high contrast sensitivity.
Tomographic scan on samples for aeronautical use
Two typical examples of composite components are shown: two carbon fiber plates with two intentionally introduced defects, and one aluminum plate bonded to a cork substrate.
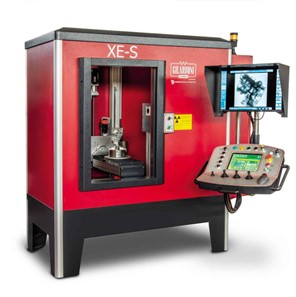
The scans were performed with a Gilardoni tomograph, model XE-S, equipped with a 150 kV X-ray source and 5 µm focal spot, a 23×23 cm detector, 12802 pixels, and a pixel size of 179 µm. With this apparatus it is possible to obtain resolutions of the order of 10 µm. Fig.4.
Application examples
Composite with carbon fibers.
- X-ray energy exposure data: 100 kV, 68 µA
- Exposure time of the panel: 333ms (3fps)
- Panel resolution: full resolution, 4096 x 4096 px
- Number of projections: 2500.
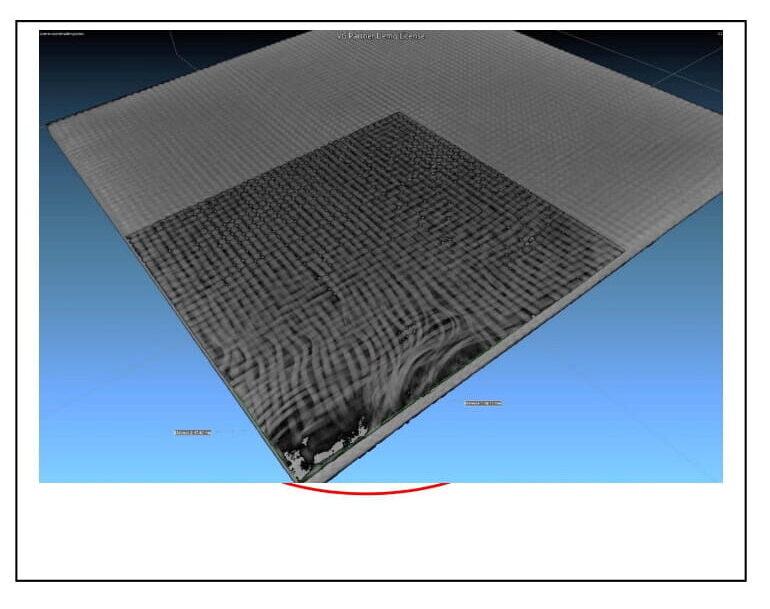
The figure 5 shows a tomography on a carbon plate measuring approximately 100×150 mm, where it was possible to detect a crack in the innermost layers, 1.2 mm from the surface. The indentation of the fibers indicates that the crack, approximately 60mm long, was caused by a collision with a small high-speed object.
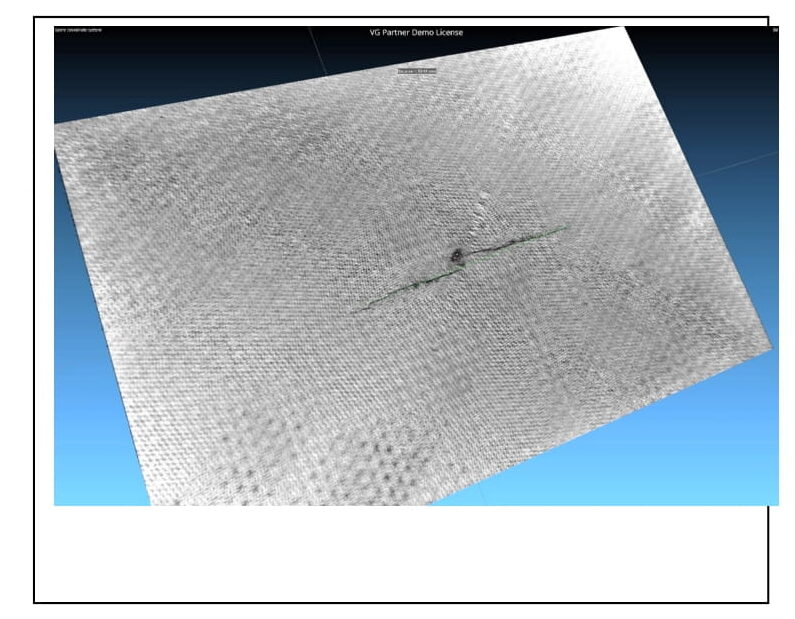
The tomography of fig.6 on another carbon plate, however, highlights a defect in the texture of the fibers, as visible from the virtual section made with the 3D rendering software. Both types of composite are widely used in the aeronautical sectors.
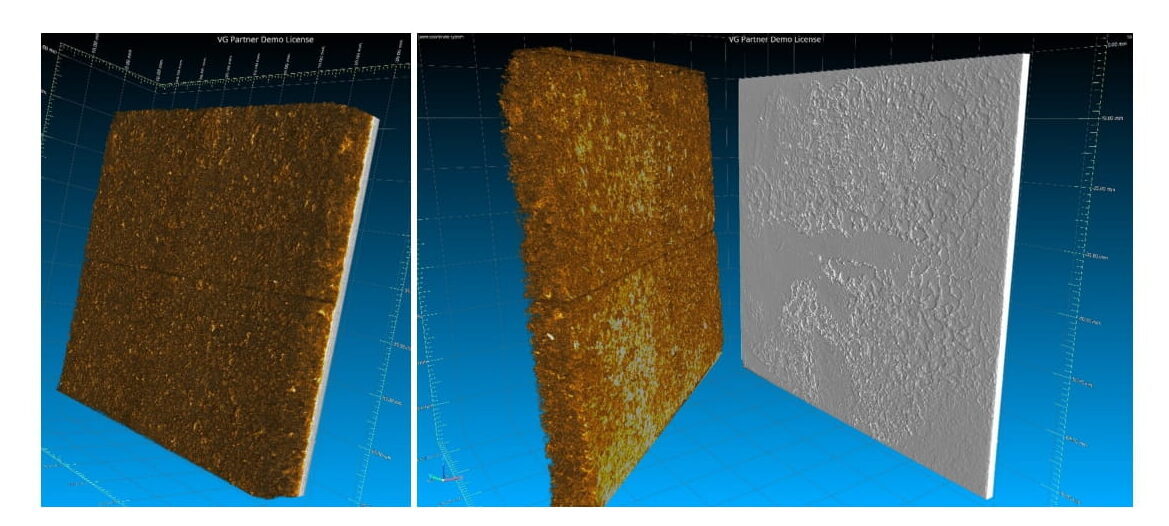
The next sample is instead an aluminum plate on which a thin cork plate; the cork it is used as a thermal barrier on rocket nose cones.
Tomography, being able to discriminate the two materials thanks to their different densities, allows, among other things, to separate them virtually; in this case, by doing so, it was possible to observe the adhesive layer and ascertain the presence of areas in which it is absent or insufficient. Fig-6-7-8. The method is also used in metal/ceramic joints.
Conclusions
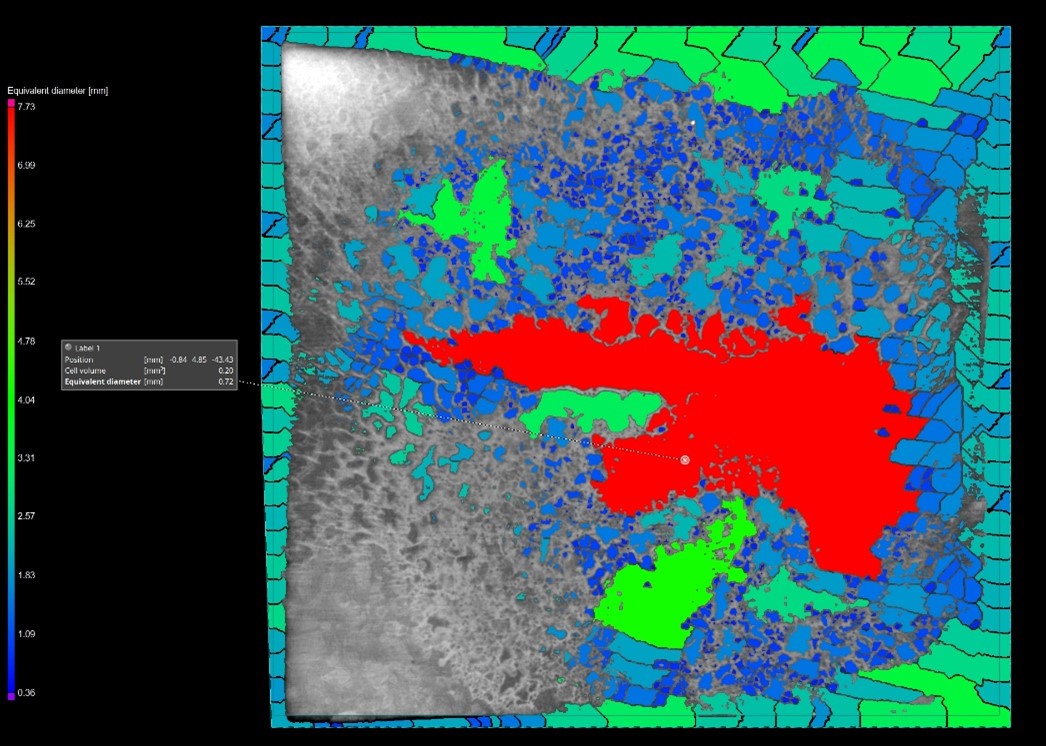
CT scanning on composite panels allows for the inspection of external and internal defects such as cracks, bumps and fiber misalignment. Panels can be sectioned along virtually any spatial direction and the cutting surface can be any other user-defined surface as well as a plane: this means that, for example, curved objects can be sectioned using a curved surface, allowing a view of the internal structures regardless of the shape of the specimen, Fig.6-7-8.
The system used allows to identify defects of the order of 30 µm, but if necessary it is possible to use other sources with smaller focal areas to have resolutions down to a few microns.
Reference legislation
ASTM E1695-20, “Standard Test Method for Measurement of Computed Tomography (CT) System Performance”.
VDI-VDE 2630 part 1.2, 1.3. “Computer tomography in dimensional measurement”
References
- The Scientist and Engineer’s Guide to Digital Signal Processing By Steven W. Smith, Ph.D.
- Elements of digital radiography K. Huang Prentice Hall Inc.
- Jackson, L.B., Signal, Systems and Transforms, 1990, p 171. Addison-Wesley, Reading, MA.
- Kak, A.C., and M. Slaney, Principles of Computerized Tomographic Imaging, 1988. IEEE Press, Piscataway, NJ.
- Kittel, C., Introduction to Solid State Physics, 4th ed., 1971, p 66. John Wiley and Sons, New York, NY.
- Rattey, P.A., and A.G. Lindgren, “Sampling the 2-D Radon Transform,” IEEE Transactions on Acoustics, Speech and Signal Processing, Vol. ASSP-29, No. 5, 1981, pp 994-1002.
- Wells, P., J. Davis, and M. Morgan, “Computed Tomography,” Materials Forum, Vol. 18, 1994, pp 111-133.
- Flisch et al. – “Industrial computed tomography in reverse engineering applications”,
- DGZfP-Proceedings BB 67-CD, Paper 8, 1999.
- Obrist et al. – “First article inspection based on industrial X-ray computed tomography”,
- Proceedings of International Conference on material testing and research, 2001, Nuremberg.
- Flisch et al. – “Efficient volume digitizing with adaptive computed tomography”,
- DGZfP-Proceedings BB 84-CD, Paper 17, 2003.
- Sauerwein et al. – “25 years of industrial CT in Europe”, DGZfP-Proceedings BB 84-CD, Paper 10, 2003.
- The Scientist and Engineer’s Guide to Digital Signal Processing By Steven W. Smith, Ph.D.